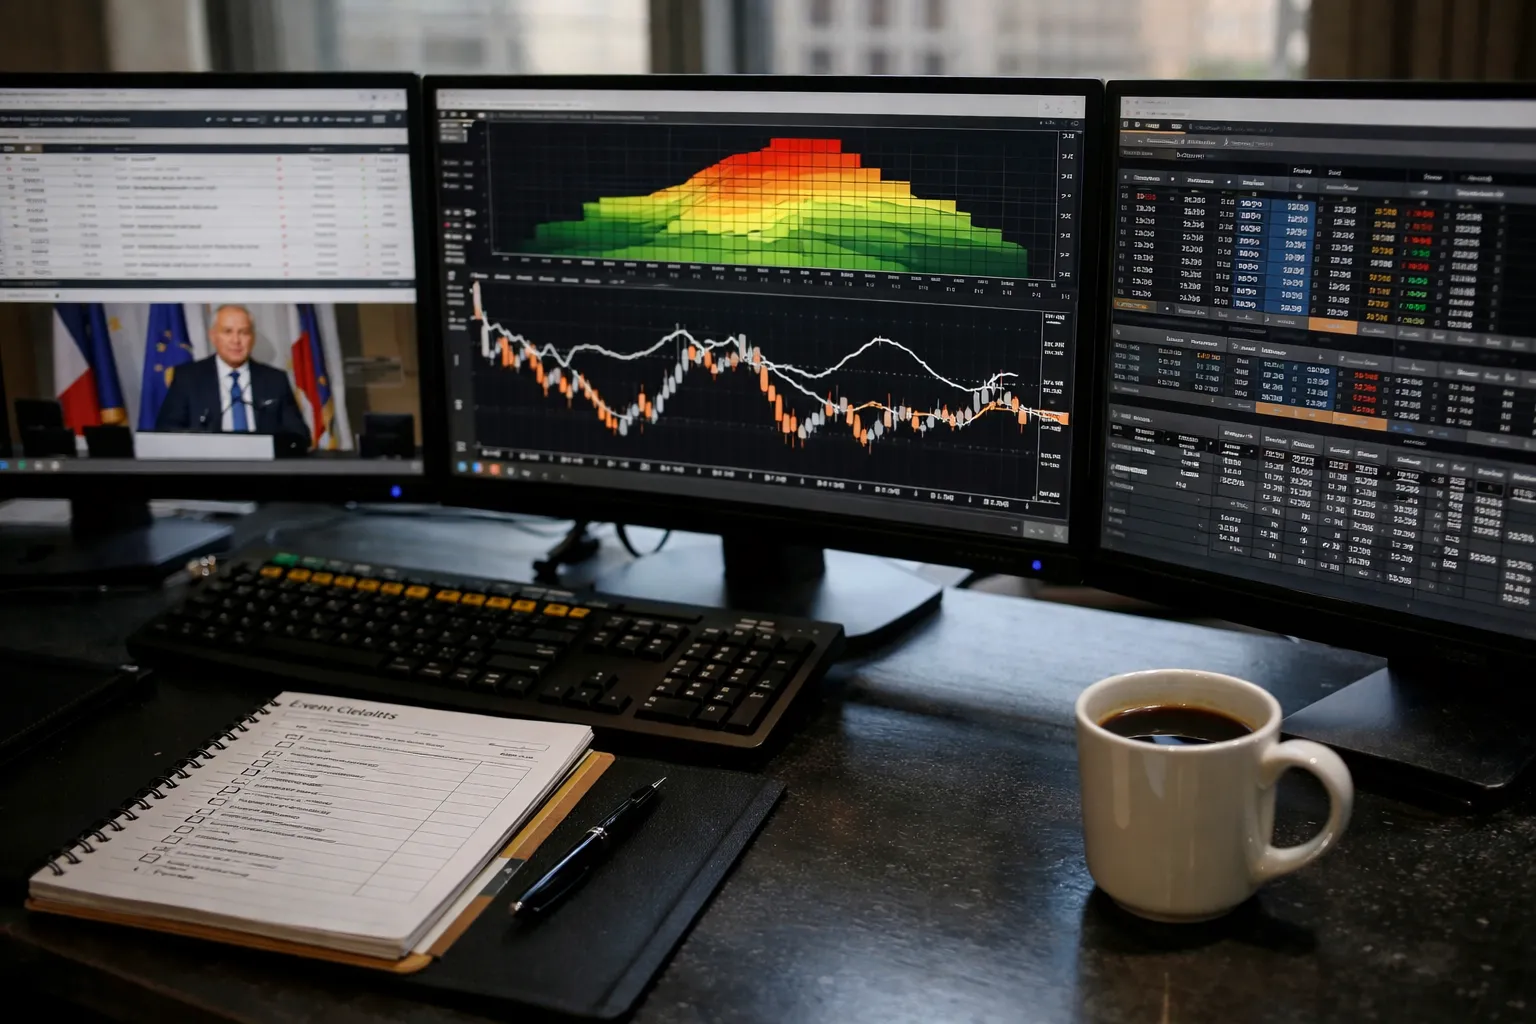
Introduction — what you will learn and why this matters now
This updated guide walks FX options traders through a disciplined process for trading volatility around central bank decisions, refreshed for August 2026. You’ll get practical, step‑by‑step instructions to: build an event calendar, convert market prices to an expected move, choose option structures that fit the 2026 liquidity landscape, size positions, execute with modern market microstructure in mind, and evaluate outcomes. This is written for retail and semi‑professional FX options traders who already understand option Greeks, delta conventions and have access to market data.
Important note on data: I cannot pull live market quotes or central‑bank actions beyond my last direct data access. The methods and worked examples below are current and actionable; where I use numeric examples, they’re clearly labeled illustrative. Replace illustrative numbers with live quotes from your data source (Bloomberg, Refinitiv, your dealer or exchange) before trading.
Prerequisites / Context
- Familiarity with option Greeks (delta, vega, theta, gamma) and 25Δ conventions.
- Access to live spot, forward curves, implied volatility surface, and order execution (dealer or listed market).
- Risk controls and a written checklist for event trades (max loss, hedging plan, exit rules).
2026 market context — what’s changed and why it matters
Since mid‑2024 dealers and desks have accelerated automation of event pricing and hedging. Two practical implications for 2026 traders:
- Faster repricing: electronic market‑makers and algos react within milliseconds to central‑bank surprises. That means pre‑event liquidity can look deep, but spreads and depth can disappear within seconds after a surprise.
- Wider divergence between on‑exchange and OTC expiries: exchanges have expanded standardized expiries (weekly/daily for liquid FX pairs in many venues), while OTC desks offer tailored expiries and bespoke deltas. Choose the venue that matches your need for precision vs. cost.
Also in 2026 many desks treat press conferences and Q&A sessions as larger volatility drivers than the headline rate call — incorporate press‑conference timing into your time horizon and hedging cadence.
Overview: the event‑volatility lifecycle (refreshed)
- Pre‑event: implied volatility (IV) and risk reversals typically rise as positioning and uncertainty grow; skew often steepens when markets expect asymmetric risk (e.g., higher-risk of hikes than cuts).
- Event: realized volatility often spikes intraday; press conferences can lengthen the “event” window beyond the headline time.
- Post‑event: IV commonly falls (vol crush). How much realized move beats the premium paid determines P&L.
Step 1 — Build an event calendar and context
- Collect event times (meeting decision and press conference) in local time and convert to your trading time zone. Use official central‑bank calendars (Fed, ECB, BoE, BoJ, SNB, RBA, RBNZ) and the exchange calendars for listed options expiries.
- Record the announcement type: rate decision only, policy statement plus projections, or decision plus press conference. Tag meetings historically where the bank published new projections (those meetings historically show larger IV premia).
- Attach market expectations: current policy rate, Fed funds OIS probabilities, or implied futures moves (CME FedWatch-style). For non‑U.S. banks use local futures/overnight index swaps.
- Compile a short history (6–20 past meetings) noting realized absolute moves and whether the meeting included a press conference or material guidance change.
Step 2 — Quantify the market‑implied expected move
Turn option prices into an event‑scale expected move.
- Choose the event horizon: same‑day expiry if you want to isolate a headline move, T+1 or T+3 if you want to capture press‑conference drift or follow‑through.
- Pull ATM IV for that expiry and note 25Δ risk reversal and 25Δ fly (butterfly) to understand skew and wing pricing.
- Compute market‑implied 1σ move: sigma_event = ATM_IV * sqrt(T_event), where T_event = days_to_event / 252. Example (illustrative): ATM_IV = 9% annual, 3 days to expiry → sigma_event ≈ 0.09 * sqrt(3/252) ≈ 0.98%.
- Compare implied 1σ to empirical distribution from your historical sample. If implied is materially above empirical, selling premium could be attractive (with hedges); if below, buyers may have an edge.
Step 3 — Choose directional vs pure‑vol trades
Select a trade category based on your informational edge.
- Pure volatility (market‑neutral): long ATM straddle or near‑ATM strangle when you expect an outsized move irrespective of direction.
- Directional with vol exposure: risk reversals or directional butterflies if skew mispricing lines up with your view.
- Income/sell premium: short premium strategies (short straddle/strangle) only when IV is historically very elevated and you have capital and tail hedges (OTM wings, longer‑dated calendar protection).
- Skew plays & arbitrage: butterflies and calendar spreads help isolate skew or term‑structure mispricings.
Step 4 — Construct practical option structures (2026 nuances)
Practical notes reflecting 2026 market microstructure:
- Use exchange‑listed expiries when you want transparent fills and to avoid OIS funding mismatches. OTC gives bespoke deltas and expiries but check dealer inventory before trade.
- Consider vanna and volga exposure explicitly—post‑2024 hedging engines price these second‑order effects more aggressively; if you’re delta‑hedging, be prepared for vanna P&L on large moves.
ATM straddle (long call + long put)
- When to use: expect >1σ move or when skew makes ATM cheaper relative to wings.
- Expiry: choose one that expires after the press conference when applicable; commonly 3–10 days.
- Risk: premium paid, vega exposure to pre‑event IV changes.
25Δ strangle
- When to use: ATM is too costly and you have conviction in a larger directional magnitude. Lower premium, requires wider move to succeed.
Risk reversal
- When to use: directional view and skew advantage. Watch short delta sizing; tail risk can be large on a surprise to the opposite side.
Calendar spread
- When to use: isolate near‑term event vega by buying short‑dated options and selling longer‑dated vega. Works well when term structure is in contango and near‑term IV is richly priced.
Step 5 — Size positions and calculate breakevens (concrete approach)
- Translate expected move to notional point moves and premium breakevens. Example (illustrative): EUR/USD 1.0800, ATM_IV = 10% annual, 4 days to expiry → 1σ ≈ 0.10 * sqrt(4/252) ≈ 1.26% → ~0.0136 pips. If ATM straddle costs 1.9% (0.0205), breakeven >1.9% move; you need >1.5σ to profit.
- Set vega limits as a fraction of capital (typical desk practice: vega exposure ≤ 3–8% of trading capital). For retail, convert to max premium at risk as a percentage of equity (e.g., no more than 1–2%).
- Quantify worst‑case and tail scenarios. For buy trades max loss = premium. For sells define worst-case notional and size position so that a tail move does not blow account (use OTM wing buys to cap risk if selling premium).
Step 6 — Execution and liquidity considerations (updated practices)
- Request multi‑dealer runs early and, where possible, use limit orders. Near events market‑maker quoting behavior can change in milliseconds — use algos or limit orders to avoid paying blown spreads.
- For large notional trades, consider block trades or working with a single, well‑capitalized dealer with explicit block liquidity commitments.
- If using exchange options, check the exchange’s intraday expiry windows and settlement times — some exchanges added intraday expiries for liquid FX pairs. Match expiry to event timing precisely to avoid unwanted theta.
Step 7 — Hedging and management through the event
- Define your delta‑hedge policy in advance: static hedge at entry vs dynamic hedge. Dynamic hedging isolates vega but creates vanna/gamma activity as spot moves.
- Pre‑arrange spot/forward liquidity with a prime or liquidity provider for event windows. Execution slippage on gamma re‑hedges can transform a profitable gross P&L into a loss.
- Consider automated delta‑hedging with pre‑set thresholds to avoid rushed, high‑slippage manual hedges during the event.
Step 8 — Post‑event closure and evaluation
- Close or roll exposure shortly after the event unless you have a new justified directional view. Vol crush commonly erodes long vega value even if the directional move was correct but smaller than premium.
- Measure outcomes versus the implied move. Track realized absolute returns during the event window against the pre‑event implied 1σ and record slippage and execution timing.
- Maintain a trade journal with IVs, deltas, fills and post‑event realized moves. Over a sufficiently large sample (>20–30 events) compute your trade hit rate and expected value per trade.
Practical worked example (replace with live August 2026 quotes)
- Illustrative scenario: EUR/USD spot 1.0800, 3 days to ECB decision + press conference, ATM_IV = 9.5% annual, ATM straddle mid = 1.7% (0.01836 USD).
- Implied 1σ = 0.095 * sqrt(3/252) ≈ 1.04% → ~0.0112 spot points. Straddle cost (1.7%) > 1σ (1.04%), so buyer needs >~1.6σ to breakeven.
- If you expect press‑conference‑driven guidance generating a 1.8% move, long straddle may be justified. If you expect a 1.0–1.1% move, consider 25Δ strangle or calendar spread to reduce premium.
Replace the illustrative numbers with live IVs and mid prices from your provider before executing.
Common mistakes and how to avoid them
- Ignoring the press conference: include communication windows in your horizon and choose expiry accordingly.
- Underestimating execution risk: pre‑price execution costs by widening assumed spreads and hedging costs in your P&L simulation.
- Overleveraging on short premium trades into high‑uncertainty events — always size short premium with capital to withstand tail moves or buy wing protection.
- Not logging outcomes — without a journal you cannot tell whether your edge is real or luck.
Pro tips (advanced)
- Use Monte Carlo event simulations calibrated to both implied and historical realized vol to estimate P&L distribution under alternative event assumptions.
- Monitor the cost of funding (OIS/futures) around event expiries — funding differentials can create trade frictions when moving between OTC and exchange instruments.
- For cross‑currency trades, use implied correlation surfaces to price multi‑leg trades; central‑bank interplay (for example, Fed vs ECB messaging) can drive correlation jumps.
- Automate your pre‑trade checklist and execution triggers to reduce emotional errors during fast market moves.
Tools and data to use
- Official central‑bank calendars and press conference schedules
- Exchange data (CME, Euronext) for listed FX options and expiry calendars
- Dealer or data‑vendor IV surfaces and risk reversal/fly quotes
- Historical event‑day spot returns for empirical distributions
- Order management systems and real‑time risk dashboards to track vega/delta exposure
Checklist before placing an event trade
- Confirm announcement and press conference times.
- Pull live ATM IV, risk reversals and butterflies for matching expiry.
- Compare IV to historical realized vol for similar meetings.
- Select option structure and venue (OTC vs exchange).
- Set notional, vega/delta limits, and stop or tail hedges.
- Pre‑arrange spot/fwd hedge path and counterparty.
- Record trade plan and breakeven math before sending orders.
Final thoughts
Event trading around central bank decisions remains a repeatable opportunity for disciplined traders. The edge is rarely in wild directional calls — it’s in precise translation of IV into event‑scale expectations, disciplined sizing, modern execution, and systematic post‑trade review. In 2026, faster electronic repricing and expanded expiry choices mean execution planning and hedging cadence are more important than ever.
FAQ
How should I choose expiry if a press conference follows the rate decision?
Include the press conference in your event horizon. Choose an expiry that covers the press conference and allows for immediate closure after — typically same‑week expiries (3–7 days) for liquid majors. If you want only the headline decision, use intraday or same‑day expiries where available, but be mindful of thinner liquidity.
Is it better to trade listed options or OTC for central‑bank events?
It depends. Listed options offer transparent pricing and robust clearing for standard expiries and are preferable for smaller or systematic trades. OTC gives bespoke expiries and deltas for fine‑grained hedging but requires confidence in dealer liquidity and inventory. For large notional or bespoke expiries, OTC is often necessary — but confirm dealer capacity before committing.
How do I account for skew and risk reversals in my trade sizing?
Skew and risk reversals reveal where the market prices asymmetric tail risk. If skew is steep (puts expensive vs calls), a directional bullish trade via a risk reversal may be cheaper than an ATM straddle. Incorporate skew into your breakeven by using a wings‑adjusted implied move (use weighted IV between your chosen strikes) rather than pure ATM IV.
Can I rely on historical realized moves to judge a current event?
Historical events are informative but not decisive. Use a historical sample to calibrate a prior, then update it with current market pricing (IV surface) and current macro drivers (policy path, data flow). Build a rolling sample (6–20 similar meetings) and weight more recent meetings higher to capture regime shifts.
What execution precautions reduce slippage during the event?
Use firm limit orders, pre‑arranged block/OTC fills for large sizes, and automated delta‑hedging thresholds. Pre‑announce large hedges to your liquidity provider when possible. Avoid last‑second market orders if you can’t tolerate wide fills; use algos that can work across the minor price moves during announcements.