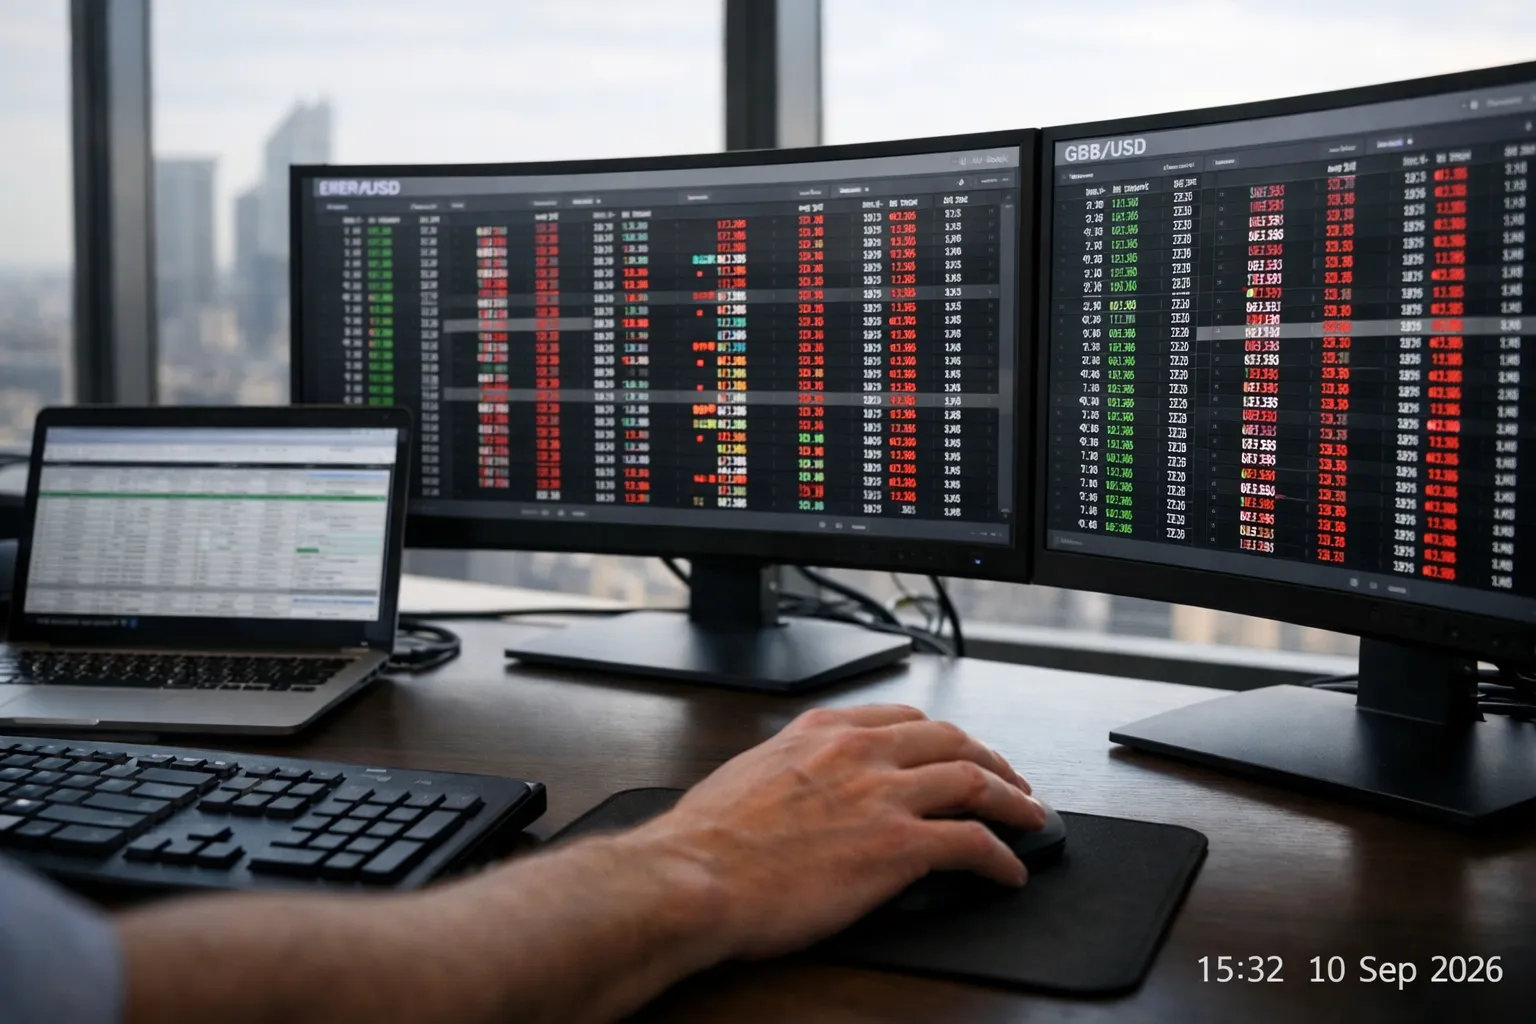
Across the first half of 2026, the behaviour of liquidity providers in global FX markets changed in observable, repeatable ways. Using a representative tick-level sample of central-limit order-book snapshots for major G10 pairs, this analysis examines how AI-driven, non-bank market‑makers reshaped intraday liquidity: compressing top‑of‑book spreads, increasing quote churn, and reducing displayed depth in thin conditions. The shifts are consequential for retail and institutional execution alike — they lower visible transaction costs but increase hidden costs for block or aggressive flow.
What we measured and why it matters
Forex Trading Daily reviewed tick snapshots and trade prints for EUR/USD, GBP/USD, USD/JPY, AUD/USD, USD/CHF and EUR/GBP across H1 2025 and H1 2026, focusing on three microstructure metrics traders care about:
- Top‑of‑book bid‑ask spread (best bid/ask gap)
- Displayed depth at best bid and offer (aggregate size at top levels)
- Quote churn and cancel-to-trade ratios (activity from quoting engines)
These metrics together capture the visible liquidity and the reliability of fills. For execution strategies — algos, smart‑order routers, and human flow desks — a narrower spread can mask increased shortfall risk if depth and fill predictability fall.
Key empirical findings
- Spread compression of roughly 20–30%: Across core G10 pairs the average top‑of‑book spread narrowed materially in H1 2026 versus H1 2025. The largest relative compression was in EUR/USD and GBP/USD, where spreads tightened by roughly a quarter on average during EU/US overlap hours.
- Displayed depth declined, especially outside core hours: While depth at the best bid/offer held up in peak liquidity windows, average displayed size per level fell by mid‑teens percent in European and Asian thin hours. Depth deterioration was most pronounced for pairs with traditionally smaller tick sizes (e.g., EUR/GBP).
- Quote churn and cancellations rose: Quote updates per second and cancel-to-trade ratios climbed in H1 2026. Market participants increasingly posted fleeting quotes that were canceled quickly if not traded against, heightening the unreliability of resting limit orders.
- Execution slippage dynamics shifted: Measured implementation shortfall for small passive limit orders improved (lower mid‑point slippage), but slippage for aggressive fills and larger block executions worsened because of reduced available depth and higher likelihood of adverse re‑pricing prior to execution.
Drivers: why AI market-making changed the book
Several interacting forces explain the observed microstructure changes:
- Algorithmic quoting calibrated to inventory and short-term signals: Non-bank market-makers deploying ML models optimize quoting with tighter spreads when their models show low short-term adverse selection. Those same models reduce posted size and withdraw more quickly when signals turn, resulting in higher quote churn.
- Competition on latency and information processing: Faster conditional quoting (sub‑millisecond decision loops) allows narrower static spreads but increases ephemeralness of liquidity. Firms deploy predictive quoting that anticipates order flow, shrinking visible spreads because they expect to aggressively manage inventory with off‑exchange hedges or internalization.
- Risk allocation and capital constraints: Non-bank MM balance sheets and capital usage differ from dealer banks; they manage risk through rapid adjustments rather than large displayed size. That behavioral change reduces depth while keeping the nominal spread tight.
- Venue fragmentation and smart‑order routing: Increased use of smart routers that sweep multiple venues fragments large size across lit and dark pools. Visible depth on any single venue therefore falls even if overall market liquidity is unaffected.
When the veneer breaks: during stress and thin hours
Two conditions reveal the fragility of compressed spreads:
- Volatility spikes and scheduled data releases: At macro prints and unexpected news events, rapid quote withdrawal leaves thin top‑of‑book risk. In such windows the instantaneous cost of aggression rose sharply — market-makers widened quotes quickly and displayed depth evaporated.
- Asian and overnight windows: During thin local hours the combination of narrow static spreads and small displayed depth means that even modest flow moves prices more than before. Traders executing during these windows face higher realized slippage relative to headline spreads.
Practical implications for traders
For FX trading strategies the observed microstructure shift requires tactical recalibration.
For small-scale, high-frequency and retail traders
- Benefit from lower quoted spreads for small, passive trades — consider more frequent use of passive limit orders during overlap hours.
- Be mindful of fill probability: when cancellation rates are high, limit orders may not fill. Use smart order routing or midpoint peg orders to increase fill rates.
For institutional flow and block executions
- Do not rely on top‑of‑book displayed size: split large orders across time, venues, and use dark liquidity or negotiated blocks where possible.
- Increase emphasis on liquidity scouting — pre‑trade liquidity heatmaps and conditional algos that adapt slice size per sub‑minute liquidity signals reduce market impact.
- Consider hybrid execution: combine passive posting to harvest better spreads with opportunistic aggressive sweeps when on‑screen depth meets your minimum size threshold.
For quantitative and algo developers
- Incorporate quote churn metrics and cancel‑to‑trade ratios into fill models; assumed static depth can understate impact costs.
- Calibrate reinforcement‑learning style algos to value fill probability separately from quoted price advantage.
- Stress-test algos for thin hours and event risk where AI market‑makers are likeliest to withdraw.
Checklist: what to monitor in H2 2026
- Top‑of‑book spread and depth across venues, by hour
- Cancel‑to‑trade and quote‑update rates (short-term reliability measures)
- Execution slippage by execution mode (passive limit, midpoint, aggressive market) and by order size
- Venue fragmentation indicators: proportion of flow routed to dark pools or internalizers
- Correlation of ML market-maker quoting with inventories — watch for systematic pattern changes after large risk events
Conclusion
H1 2026 was the breakpoint at which AI‑driven market-making became measurably dominant in shaping visible FX liquidity. The good news for many traders is materially lower quoted spreads during core hours. The less visible reality is higher transient risk: shallower depth, greater quote churn, and larger slippage for size or aggression. For any trader — retail or institutional — the appropriate response is not to blindly chase narrower spreads but to adopt execution frameworks that measure and respond to depth and reliability in real time. That recalibration will determine who benefits from the new generation of liquidity providers and who pays for its hidden costs.