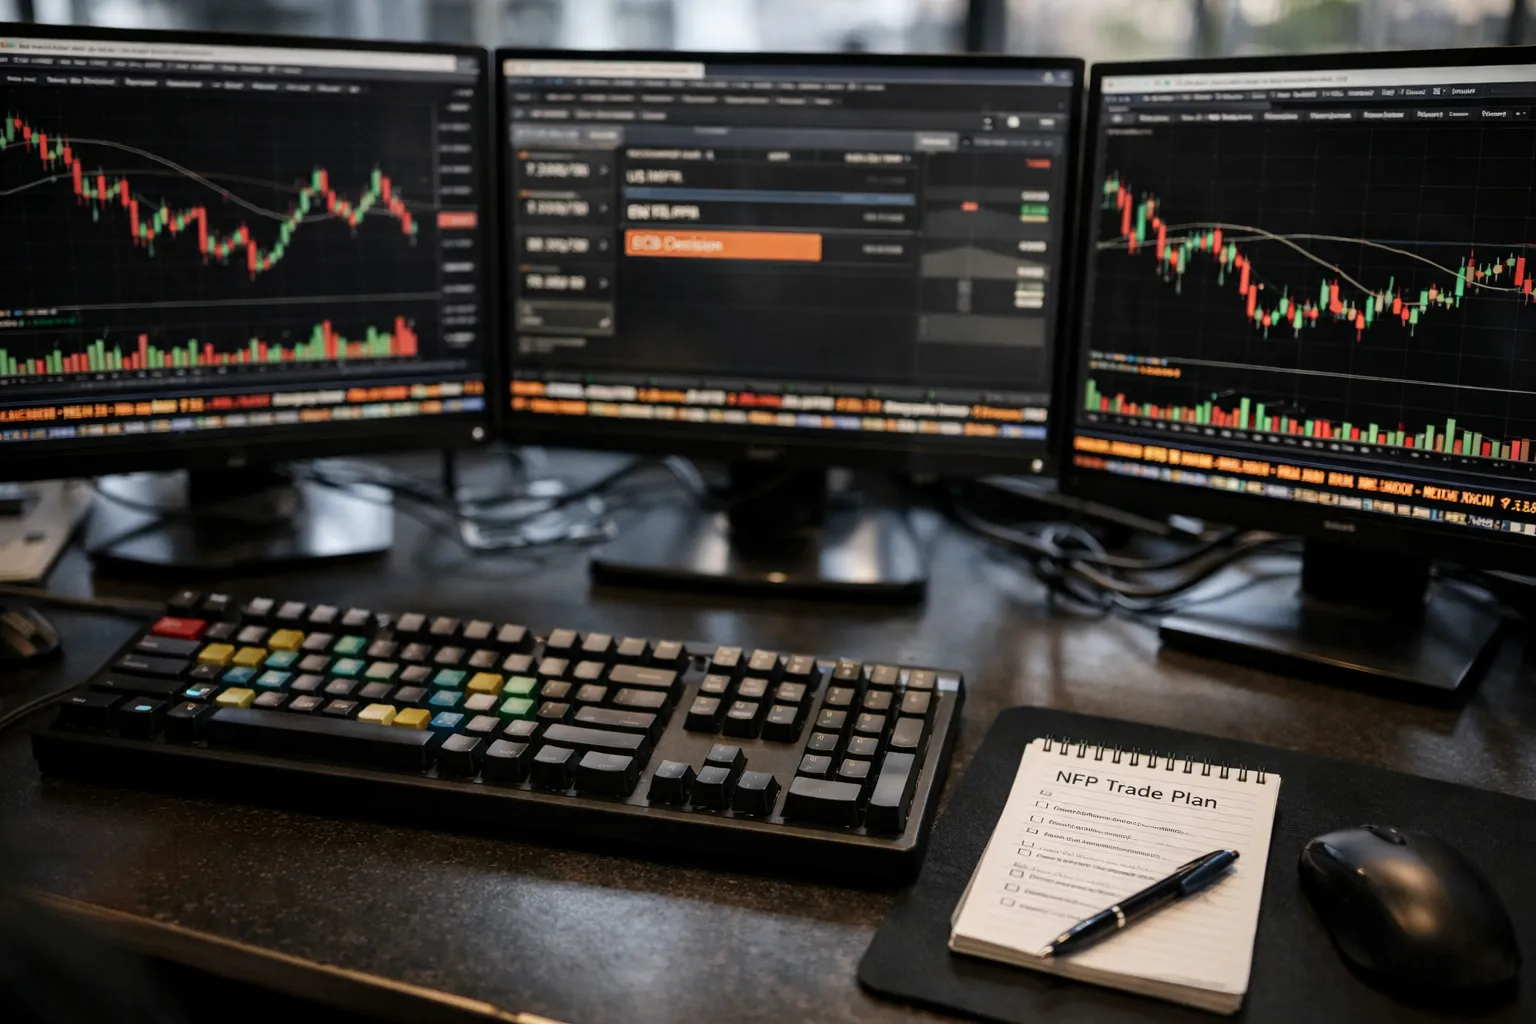
Event-driven intraday moves remain among the most reliable opportunities in foreign exchange. For active FX traders, two recurring windows — US Nonfarm Payrolls (NFP) and European Central Bank (ECB) policy announcements — produce predictable spikes in volatility and liquidity regime shifts. This guide walks through building a repeatable, volatility‑adjusted intraday breakout strategy specifically tailored to those events: from data requirements and entry rules to backtesting, execution tactics and live risk controls.
Why focus on NFP and ECB?
NFP and ECB decisions combine a predictable schedule with news that materially alters macro expectations. NFP is released first Friday monthly at 8:30 ET (data vendor timing may differ by seconds), and ECB decisions are scheduled roughly every six weeks with an accompanying press conference. Both create compressed windows of elevated realized volatility and widened spreads — ideal for a disciplined, event‑specific intraday approach.
This strategy targets short‑term breakouts that capture initial directional conviction while managing increased execution risk. It is not a scalping script or long‑term carry trade; rather, it is a structured procedure to trade price discovery that follows a major macro print.
Step 1 — Define the objective and universe
- Objective: Capture the first 15–60 minutes of directional volatility after NFP or ECB announcements using volatility‑adjusted breakout entries and strict risk controls.
- Universe: Major crosses with deep liquidity and event sensitivity: EUR/USD, USD/JPY, GBP/USD, EUR/GBP. Limit to 1–2 pairs per event to avoid overexposure.
- Timeframe: Intraday tick or 1‑minute bars for execution; 1‑minute to 5‑minute bars for signal generation and backtests.
Step 2 — Data and tools required
- Price data: Tick or millisecond quote data from your execution platform (for accurate spread & slippage estimates) and consolidated historical 1‑min bars for backtesting.
- Economic event feed: A reliable calendar feed with timestamped release times (e.g., Bloomberg, Reuters, Econoday API). Ensure your feed timestamps match the market data clock to within a second.
- Volatility input: Short‑term realized volatility (rolling 1–5 day ATR or 30‑minute prior realized vol) and option implied volatility (1‑month ATM IV if available). If you don’t have options IV, use ATR and historical event multipliers instead.
- Execution tools: Ability to send limit/market/take‑profit/stop orders programmatically or via fast GUI, and access to tick prints to measure slippage.
- Backtest environment: Event‑based backtester that can simulate pre‑ and post‑event liquidity (spread widening), order queuing and slippage models.
Step 3 — Event window and baseline volatility
Define symmetric windows around the release:
- Pre‑event baseline window: 60–120 minutes before the release. Use this to compute baseline ATR (e.g., 30‑minute ATR) and average spread.
- Event window: Typically 0–60 minutes after the release for initial directional capture. Many traders use 0–15 minutes for aggressive capture and extend to 60 minutes for trending follow‑through.
- Cooldown window: 60–120 minutes after the event during which you close remaining positions or widen stops because liquidity often normalizes but directional momentum can reverse.
Compute volatility ratio: event_volatility_multiplier = (30‑min ATR in first 30 minutes post‑release) / (30‑min ATR pre‑event average). Historically for NFP, this multiplier is often 2–6x depending on the surprise size; use empirical measures from your data to calibrate.
Step 4 — Entry rules (volatility‑adjusted breakout)
Core idea: Wait for a clean breakout beyond a short pre‑event range, but scale the breakout threshold and position size by the volatility ratio and implied vol.
- Establish the reference range: Take the high and low of the 15–30 minutes immediately before release (this captures the compressed pre‑event range).
- Define breakout thresholds: threshold = reference_range_size × K / vol_adjust, where K is a base multiplier (e.g., 1.0) and vol_adjust = max(1, IV_1m / IV_baseline) or realized_vol_ratio. If IV is elevated, reduce threshold to be more responsive; if IV is low, raise threshold to avoid noise.
- Entry trigger: Enter long when price prints above high + threshold; enter short when price prints below low − threshold. Use market order if you need immediacy, or small aggressive limit (inside spread) if the venue supports it and you have high fill probability.
- Anti‑fading rule: If the first 3 minutes post‑release show an immediate reversal of >0.6×ATR, avoid adding until a new confirmed breakout occurs.
Step 5 — Position sizing and risk controls
- Risk per trade: 0.25%–0.75% of equity typical for event trading. For conservative traders use ≤0.25%.
- Initial stop: ATR‑based: stop_distance = ATR_30min × S, where S is 0.75–1.5 depending on pair and event. For NFP you might use 1.25×ATR; for ECB, use 1.5×ATR because headline moves can be larger.
- Profit targets: Use a multi‑leg plan: partial take at 1×stop_distance (risk:reward 1:1), remainder at 2–3×stop_distance; or implement ATR‑trailing stops to capture trends beyond the initial impulse.
- Per‑day loss limit: Hard stop that prevents further event trades after cumulative losses exceed X% (e.g., 1.5% of equity) on that event day.
- Max concurrent exposure: Limit to one event trade per currency pair and no more than two pairs per event.
Step 6 — Execution tactics and spread management
Event windows widen spreads and increase slippage. Practical execution tactics:
- Estimate realistic spreads from tick data during past events; widen the entry threshold or include spread buffer to avoid stop‑outs on spread noise.
- Prefer ECN/prime‑broker liquidity for lower median spreads. Market‑maker retail platforms often widen more aggressively during events.
- Use market orders only when immediate fill is essential. An aggressive limit inside the spread can reduce slippage if your platform supports post‑only cancellations and you have a fast connection.
- If you trade via manual GUI, prepare hotkeys and pre‑set OCO (one‑cancels‑other) order templates to place entry+stop+target in under 10 seconds after the release.
Step 7 — Backtesting and forward testing
Event strategies require specialized testing. Standard time‑series backtests that ignore spread, latency and event microstructure will overestimate edge. Follow these steps:
- Build an event database of releases with exact timestamps and the released value (e.g., NFP print vs consensus). Tag each release with surprise magnitude (actual − consensus).
- Use tick or sub‑second quote data to simulate fills, capturing spread widening within ±5 minutes of each release.
- Model slippage as a function of realized volatility and broker behaviour. Calibrate slippage using past trades or sample fills from your broker.
- Run event‑based backtests over multiple years, separate by market regimes (high vs low IV). Evaluate event return distribution, hit rate, average slippage, max drawdown and time‑to‑close metrics.
- Forward test in a small live size (paper or small capital) for at least 50–100 events before full allocation. Maintain an execution journal to measure real slippage vs simulated slippage and adjust models accordingly.
Step 8 — Example scenarios
Example A — NFP strong surprise (+350k vs +200k consensus): EUR/USD sells off aggressively. Pre‑event 30‑min ATR = 6 pips; post‑event realized spike pushes ATR to 24 pips (4×). Using threshold K=1 and vol_adjust=4, threshold = (pre‑range_size)×0.25 — a smaller threshold makes entry responsive. Enter short on breakout, initial stop = 1.25×pre_ATR = 7.5 pips, partial target at +7.5 pips, remainder at +15 pips or trailing stop at ATR×0.75.
Example B — ECB hold with hawkish guidance: EUR/USD gaps up slowly during the press conference; first 15 minutes exhibit choppy price action and multiple false breakouts. Use anti‑fading rule and require two successive 1‑minute closes above threshold before initiating a buy. Use wider stops (1.5×ATR) and prefer trailing to capture slow trending moves.
Common pitfalls and how to avoid them
- Ignoring spread widening: Always model and measure event spreads. If your broker’s spreads blow out excessively, adjust thresholds or avoid trading that venue for events.
- Overtrading during noise: Use the anti‑fading and multi‑bar confirmation rules to reduce false entries.
- Poor data alignment: Ensure your event timestamps and market data clocks are synchronized; a one‑second mismatch can create erroneous signals in high‑frequency windows.
- No execution rehearsal: Practice placing orders and OCO templates on demo accounts to build muscle memory; seconds matter in event trading.
Operational checklist before live trading
- Confirm economic calendar and exact release time in your data feed.
- Preload order templates and hotkeys for the selected pair(s).
- Verify your broker’s historical event spreads and check connectivity latency.
- Run a quick volatility check 30 minutes pre‑event: if IV or realized vol is at an outlier level, consider reducing size or skipping.
- Set hard daily loss limits and confirm they are enforceable by your risk platform or manual process.
Measuring success and iterating
Track the following metrics by event and by pair:
- Average P&L per event, hit rate, average win/loss size
- Average slippage and fill rate
- Time‑to‑exit and proportion of trades closed at partial target vs trailing stop
- Performance by surprise magnitude (small, medium, large) and by market regime (high vs low IV)
Iterate on thresholds, stop multipliers and entry confirmation rules based on segmented analysis. The best event strategies are simple, well‑measured and adapted to your execution environment.
Final notes
Event trading is a concentrated, high‑variance activity. A volatility‑adjusted breakout framework — which scales thresholds and sizing by realized and implied volatility — helps normalize risk across disparate events and market regimes. The key to success is not prediction but disciplined execution: accurate data, realistic slippage modeling, tight risk controls and rigorous forward testing.
Use this guide as a blueprint. Start small, measure every event, and refine your ruleset to your broker, capital size and temperament. With careful preparation, NFP and ECB windows can be a consistent source of repeatable intraday opportunity.