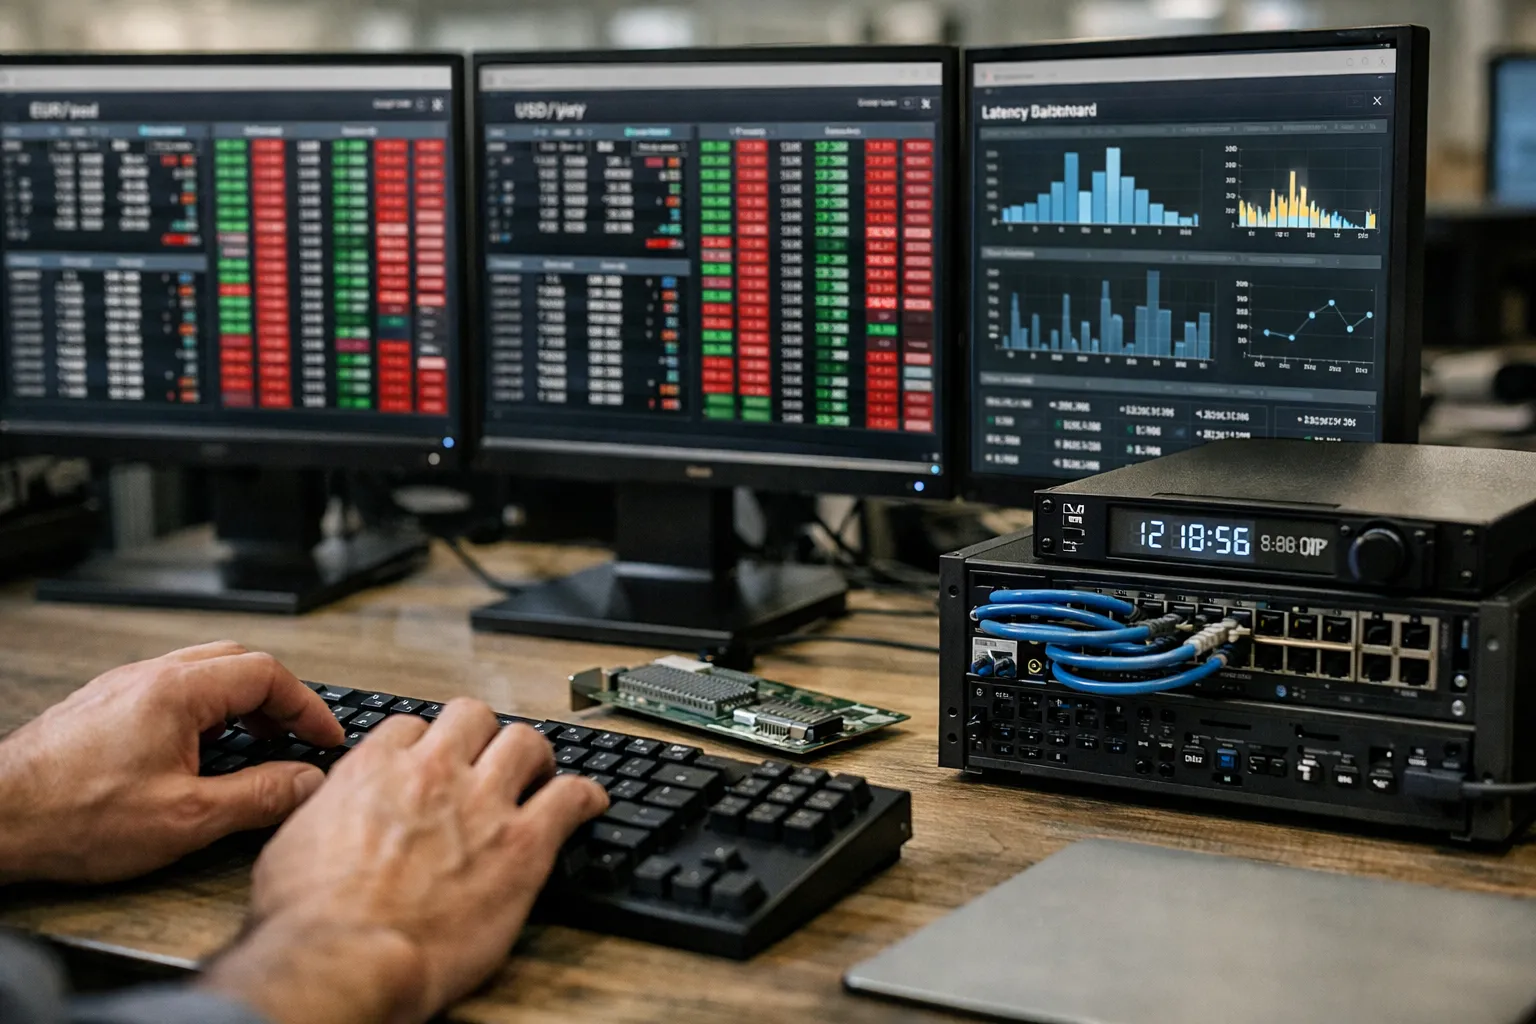
Introduction — what you’ll learn and why it matters
This July 2026 update gives forex trading enthusiasts a concrete, actionable playbook to measure and reduce FX execution latency—and to decide if latency investments are worth the cost. You’ll get current, practical steps (from measurement to deployment), updated examples reflecting mid‑2026 infrastructure and market trends, and clear rules for prioritising work that moves P&L. This is for retail traders, boutique prop desks, and technologists who run execution-sensitive algos or want to stop losing money to avoidable slippage.
Prerequisites and context (what to know first)
Before you begin: you need basic access to your execution stack and telemetry. That usually means:
- An execution account where you can run test orders or a demo that mirrors production routing.
- Access to the host that sends orders (so you can capture FIX logs or packet traces).
- Permission from your broker to run low-frequency synthetic tests (many brokers allow this if you flag them first).
- Familiarity with simple networking and time sync concepts (NTP/PTP) or a colleague who is.
Why mid‑2026 matters: infrastructure has continued to evolve. Colocation and dedicated interconnect remain the fastest options; but several cloud and connectivity providers now offer turnkey “close-to-exchange” options (Equinix interconnects, cloud bare-metal with direct fiber links). Hardware timestamping and PTP grandmasters at more venues mean you can now get more accurate latency attribution—if you capture the right signals.
Step 1 — Define the execution metrics that matter
Make your metrics explicit and tied to P&L. Update the original list with two additions that matter in 2026:
- Order-to-fill latency: elapsed time from submitted order to first fill (partial or full). Track median and tail percentiles (75th, 95th, 99th).
- Market-data-to-order latency: time from reception of a market update that should trigger an order to when the order is emitted.
- Fill quality: realised slippage in pips; track per-pair, per-hour, and percentiles.
- Pre-trade fairness: how often your marketable orders are crossed against better-priced orders shortly after submission.
- Queue position and visible liquidity latency (2026 addition): when venues publish queue-position or visible-depth timestamps, capture the delta between the published position and your fill to understand queuing costs.
- Tail event exposure (2026 addition): frequency and duration of latency spikes tied to market events (economic prints, major crosses) measured as exceedance over threshold.
Step 2 — Baseline measurement: methods and tools (updated)
Best practice in 2026 remains: use at least two independent measurement methods and always capture hardware timestamps where possible.
Method A — FIX / application timestamps (with caveats)
Record TransactTime and any broker-provided execution timestamps. Many brokers now provide nanosecond-resolution timestamps in execution reports; still treat them as one signal, not the whole truth. Caveats: clock skew, gateway batching, and timestamp semantics vary across firms.
Method B — Packet capture (pcap) with hardware timestamps
Run packet capture on the host NIC or a dedicated TAP. In 2026, use NICs that support IEEE 1588 PTP and hardware nanosecond timestamping (Intel, Broadcom, Mellanox/Marvell drivers). Correlate by order ID. For highest accuracy, capture both the outgoing NewOrderSingle and incoming ExecutionReport, and prefer kernel-bypass capture appliances or FPGA TAPs when available.
Method C — Synthetic order correlation and market replay
Send time-stamped synthetic orders at non-disruptive sizes and match them to market events. Also run market-replay tests in an isolated environment (cloud or lab) to measure algorithmic reaction times against tick-level data. Use replay to validate decision latency without involving production flows.
Time sync and observability
PTP (IEEE 1588) is the standard for nanosecond-level alignment where venues support it; NTP remains acceptable for coarse diagnostics. Use both: run PTP for production trading hosts and keep NTP as a fallback. In 2026 more venues and brokers publish PTP grandmaster addresses—request them and bind your PTP configuration to the vendor’s recommended profile.
Step 3 — Build a latency budget (revisited)
A latency budget allocates the order-to-fill timeline into measurable components you can act on. Typical 2026 budget items and ranges (example values):
- Market data arrival to strategy decision: 0.2–10 ms (depends on model complexity and whether you run ML inferencing on CPU/GPU).
- Order construction and serialization: 0.05–3 ms (optimized binary vs verbose FIX/XML).
- Host scheduling, kernel jitter: 0.1–5 ms (real‑time kernels or CPU isolation reduce this).
- Network transit to broker/gateway: 0.5–200 ms (colocation vs remote; modern leased lines and optimized routes can bring remote times lower).
- Broker/gateway processing and routing: 0.1–50 ms (depends on gateway batching, anti-spam, regulatory checks).
- Venue matching engine/end-of-pipe latency: 1 ms to tens of ms (varies by venue and matching model).
Example updated budget (remote retail): Market data 15 ms + strategy 3 ms + network 60 ms + broker 15 ms + venue 10 ms = 103 ms. Your first optimisation targets the largest controllable items.
Step 4 — Decide where to invest (new decision signals for 2026)
Use quantitative decision rules rather than intuition. Updated checklist:
- Model expected P&L improvement per ms reduced: compute trade frequency × edge-per-trade sensitivity to latency. If the expected return on a large upgrade is under your internal hurdle rate, don’t proceed.
- For strategies with tight latency sensitivity (scalping, market-making), prefer colocation and direct market gateways. For directional or low-frequency strategies, opt for cheaper software and order-type improvements.
- Consider hybrid investments: colocate only for a subset of currency pairs or instruments where latency matters most (e.g., EUR/USD on a primary ECN), keep the rest on remote connections.
- Factor in operational costs in 2026 (colocation, cross-connects, PTP support): these have fallen relative to 2022 but still form a recurring expense. Build total-cost-of-ownership models for 1–3 years.
Step 5 — Practical optimisations by layer (what to change first)
Broker and venue selection
- Ask brokers for detailed latency distributions (median, 95th, 99th) and for their timestamping methods (PTP vs application). Prefer brokers who provide NIC-level timestamps or attach hardware-timestamped execution reports.
- Use venues offering direct ECN access and multicast market data for deterministic feeds. Retail APIs are improving—many now offer low-latency TCP/UDP endpoints or WebSocket/QUIC for non-critical flows.
Network and physical layer
- Colocate for sub-millisecond needs; otherwise use managed dark-fiber or optimized leased lines. In 2026, major cloud providers and interconnection fabrics offer lower-latency bare-metal options close to major FX hubs—evaluate them for cost/benefit.
- Enable NIC hardware timestamping and configure PTP with a reliable grandmaster. Keep a PTP-monitoring dashboard for drift and holdover events.
Software and OS tuning
- Harden hosts: real-time kernels, CPU isolation, IRQ affinity, and disabling unnecessary background tasks.
- Prefer compact binary serialization for orders. Where FIX is required, use FIX FAST (or at least tuned FIX engines) and minimize session-level chatter.
- For extreme low-latency paths, evaluate kernel bypass (DPDK, AF_XDP) or user-space TCP stacks; these are more accessible in 2026 with matured toolchains and better community support.
Order strategy changes
- Use adaptive order types: pegged or mid-price pegged orders can reduce slippage without massive latency upgrades.
- For size, use execution algos (TWAP/VWAP/POV) rather than forcing marketable fills if latency gains are expensive.
- Continually re-evaluate aggressiveness parameters with live slippage telemetry—automate small adjustments when liquidity thins.
Step 6 — Quantify slippage and model execution cost (advanced)
Don’t just measure mean slippage. In 2026, execution cost models should be stateful and conditional:
- Bucket slippage by pair, notional, spread, and market regime (quiet, regular, news-driven). Track percentiles (50/75/95/99).
- Calculate cost-per-trade and annualised cost using your actual trade frequency. Example: a strategy taking 2,000 trades/year with average extra slippage 0.4 pip on EUR/USD (100k lot, $10/pip) equals $8,000/year.
- Model tail-risk: occasional outlier fills (5–10 pips) can erase strategy edge—include this in risk-adjusted returns.
Step 7 — Backtest execution with realistic fills (updated best practices)
Integrate empirically measured slippage into backtests. In 2026, use state-dependent slippage and simulate queuing behaviour:
- Use tick-level market data and replay to model order queuing and fill probability.
- Apply conditional slippage models: e.g., slippage(pips) = f(spread, volume_at_top, hour_of_day, volatility).
- Validate the backtest by running a paper-trade period and comparing predicted vs realised slippage; iterate until models converge.
Step 8 — Monitoring and continuous measurement (operationalise)
Make latency observability a living system:
- Dashboards: median and tail order-to-fill latency by broker/venue, slippage percentiles by pair/time-of-day, and queue-position deltas where available.
- Automated alerts: e.g., alert when median latency rises 50% or 95th percentile slippage exceeds an absolute threshold.
- Post-event forensic tools: keep pcap retention for at least 72 hours and longer for regulatory needs. Use eBPF traces or kernel telemetry to attribute spikes to software, host, or network causes.
Common mistakes to avoid
- Optimising for the single best-case latency number. Focus on median and tails that affect P&L.
- Relying on broker-provided timestamps alone. Corroborate with host-side packet timestamps.
- Buying colocation as a first step. Often smarter routing, different order types, or a better broker yields more benefit at lower cost.
- Ignoring measurement drift. Time-sync loss or software updates can silently change behaviour.
Pro tips (advanced, high-leverage actions)
- Run a split experiment: route a small percentage of real volume through the low-latency path and compare realised slippage vs baseline before committing.
- Use eBPF to capture in-kernel latencies without heavy instrumentation—great for isolating kernel-induced jitter on Linux hosts.
- Prioritise pair-specific improvements: focus on pairs where you trade most or where spreads are tight (EUR/USD, USD/JPY), not where liquidity is inherently poor.
- Keep a “regression baseline” test suite that runs after any stack change (OS upgrade, broker switch) to detect regressions quickly.
Actionable checklist (ready to use)
- Choose primary metrics (order-to-fill, market-data-to-order, 95th/99th slippage percentiles).
- Enable PTP and NIC hardware timestamps; verify PTP grandmaster addresses with your broker/venue.
- Collect at least 1,000 orders across key time-of-day buckets using both FIX logs and pcap with hardware timestamps.
- Build a latency budget and target the largest controllable line items.
- Run a split live experiment before committing to colocation or costly circuits.
- Replace ideal fills in backtests with empirically measured, state-dependent slippage models.
- Set up real-time monitoring with alerts for median and tail latency/slippage spikes.
Final considerations
Latency optimisation remains a continuous, evidence-driven discipline in 2026. New infrastructure options and broader PTP adoption make measurement more precise—but they also make it easier to be misled by single metrics. Use multiple independent signals, prioritise changes that demonstrably move P&L, and treat colocation and kernel-bypass as last-mile tools when cheaper fixes are exhausted.
FAQ
How much latency reduction is worth paying for?
Compute expected annual P&L uplift: (edge improvement per trade in $) × (number of trades/year) − incremental cost. If the delta exceeds your investment hurdle (including recurring costs), it’s likely justified. For many retail traders the breakeven is often several thousand dollars per year; for market-makers it can be much lower.
Can cloud providers replace colocation for low-latency FX?
Cloud bare-metal and dedicated interconnect options have narrowed the gap for some use cases. They are suitable for latency-tolerant or mid-frequency strategies and for rapid scaling. For sub-millisecond unilateral latency and deterministic microsecond jitter required by high-frequency market-making, physical colocation at exchange-aligned facilities still leads.
Is packet capture necessary if my broker provides timestamps?
Yes. Broker timestamps are useful but can differ in semantics and resolution. Host-side packet capture with hardware timestamps provides an independent, auditable signal and helps attribute latency to host, network, or broker. Use both for best results.
What’s the simplest change that reduces slippage for most traders?
Improve broker selection and order types: switching to a broker that offers tighter median routing, using limit/pegged orders intelligently, and adding adaptive aggressiveness will often yield larger P&L improvements than expensive infrastructure changes.
How do I handle tail latency during macro events?
Build regime-aware controls: increase order conservatism (wider limits, lower participation rates) around scheduled macro prints; add automated throttles for sudden spikes in 95th/99th percentile latency; and post‑event, re-evaluate slippage models using the new tail data.